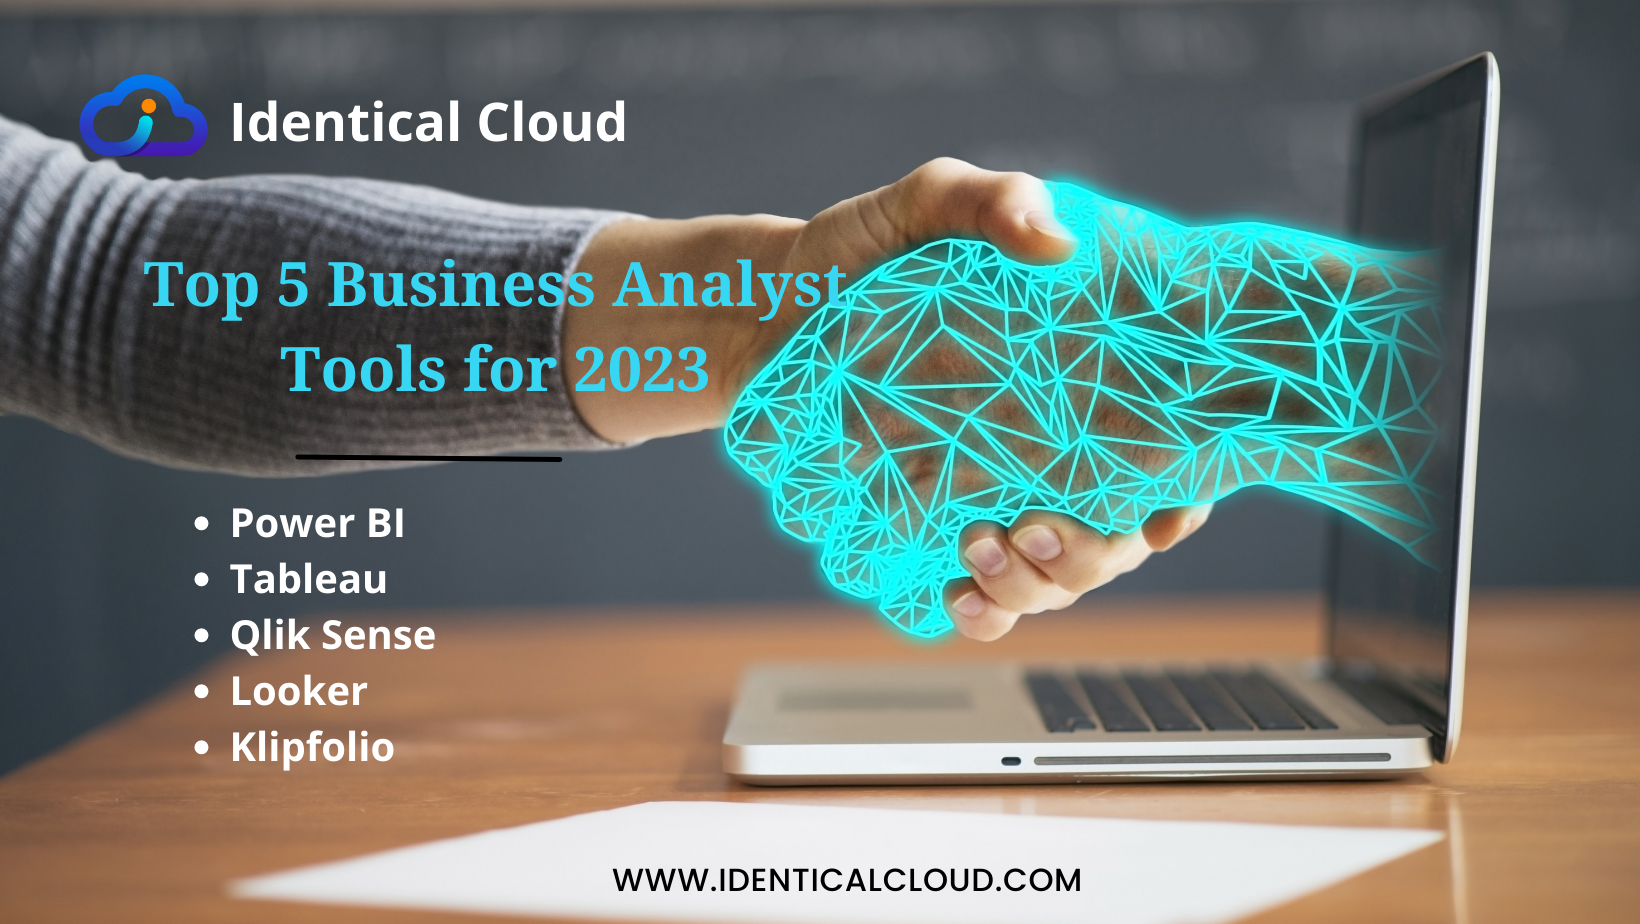
Top 5 Business Analyst Tools for 2023
Top 5 Business Analyst Tools for 2023
Business analysts are responsible for understanding the needs of a business and translating those needs into technical requirements for IT solutions. They use a variety of tools to help them in this process, including data visualization tools, business process modeling tools, and project management tools.
The following are the top 5 business analyst tools for 2023:
1. Microsoft Power BI
Microsoft Power BI is a business intelligence (BI) tool that helps businesses collect, analyze, and visualize data. It is a powerful tool that can be used by business analysts to create dashboards and reports that help businesses make better decisions.
Power BI is easy to use and can be integrated with other Microsoft products, such as Excel and SQL Server. It also has a large community of users who can provide support and advice.
Here are some of the key features of Microsoft Power BI:
- Collect data from a variety of sources, including Excel, SQL Server, and cloud-based data sources.
- Analyze data using a variety of tools, including pivot tables, charts, and graphs.
- Visualize data in a way that is easy to understand and interpret.
- Share dashboards and reports with others.
- Automate tasks to save time and effort.
Power BI is a powerful tool that can be used by businesses of all sizes. It is a good choice for businesses that are looking to improve their decision-making process by using data.
Here are some of the benefits of using Microsoft Power BI:
- Improved decision-making: Power BI can help businesses make better decisions by providing them with insights into their data.
- Increased efficiency: Power BI can help businesses save time and effort by automating tasks and providing self-service analytics.
- Improved collaboration: Power BI can help businesses collaborate more effectively by sharing dashboards and reports with others.
- Increased visibility: Power BI can help businesses gain visibility into their data by providing them with dashboards and reports that are easy to understand.
2. Tableau
Tableau is another popular BI tool that is known for its powerful data visualization capabilities. It can be used to create interactive dashboards and reports that help businesses understand their data.
Tableau is easy to use and can be used by business analysts with no prior experience in data visualization. It also has a large community of users who can provide support and advice.
Here are some of the key features of Tableau:
- Connect to a variety of data sources, including Excel, SQL Server, and cloud-based data sources.
- Explore and analyze data using a variety of tools, including pivot tables, charts, and graphs.
- Create interactive dashboards and reports that are easy to understand and interpret.
- Share dashboards and reports with others.
- Automate tasks to save time and effort.
Tableau is a powerful tool that can be used by businesses of all sizes. It is a good choice for businesses that are looking to improve their decision-making process by using data.
Here are some of the benefits of using Tableau:
- Improved decision-making: Tableau can help businesses make better decisions by providing them with insights into their data.
- Increased efficiency: Tableau can help businesses save time and effort by automating tasks and providing self-service analytics.
- Improved collaboration: Tableau can help businesses collaborate more effectively by sharing dashboards and reports with others.
- Increased visibility: Tableau can help businesses gain visibility into their data by providing them with dashboards and reports that are easy to understand.
3. Qlik Sense
Qlik Sense is a BI tool that is known for its ability to discover insights from data. It uses machine learning and artificial intelligence to help businesses find patterns and trends in their data.
Qlik Sense is a powerful tool that can be used by business analysts to gain a deeper understanding of their data. However, it can be more complex to use than some other BI tools.
Here are some of the key features of Qlik Sense:
- Associative analytics engine: This engine allows users to explore their data in a natural way, without having to know SQL or other programming languages.
- Wide range of visualizations: Qlik Sense has a wide range of visualizations that can be used to represent data in a variety of ways.
- Ability to customize visualizations: Users can customize their visualizations to fit their specific needs.
- Ability to share visualizations: Users can share their visualizations with others.
- Integration with other applications: Qlik Sense can be integrated with other applications, such as Salesforce and SAP.
Qlik Sense is a powerful tool that can be used by businesses of all sizes. It is a good choice for businesses that are looking to improve their decision-making process by using data.
Here are some of the benefits of using Qlik Sense:
- Improved decision-making: Qlik Sense can help businesses make better decisions by providing them with insights into their data.
- Increased efficiency: Qlik Sense can help businesses save time and effort by automating tasks and providing self-service analytics.
- Improved collaboration: Qlik Sense can help businesses collaborate more effectively by sharing visualizations with others.
- Increased visibility: Qlik Sense can help businesses gain visibility into their data by providing them with visualizations that are easy to understand.
4. Looker
Looker is a data exploration and analytics platform that helps businesses create custom data models, metrics, and dashboards. It is a powerful tool that can be used by business analysts to gain a deeper understanding of their data.
Looker is easy to use and can be integrated with other BI tools, such as Tableau and Power BI. However, it can be more expensive than some other BI tools.
Here are some of the key features of Looker:
- Easy to use: Looker is designed to be easy to use, even for users with no prior experience with data analysis.
- Wide range of data sources: Looker can connect to a wide variety of data sources, including cloud data warehouses, on-premises data warehouses, and flat files.
- Custom data models: Users can create custom data models to fit their specific needs.
- Interactive visualizations: Looker provides a variety of interactive visualizations that can be used to represent data in a variety of ways.
- Sharing capabilities: Users can share their data models and visualizations with others.
- Integration with other applications: Looker can be integrated with other applications, such as Salesforce and Tableau.
Looker is a powerful tool that can be used by businesses of all sizes. It is a good choice for businesses that are looking to improve their decision-making process by using data.
Here are some of the benefits of using Looker:
- Improved decision-making: Looker can help businesses make better decisions by providing them with insights into their data.
- Increased efficiency: Looker can help businesses save time and effort by automating tasks and providing self-service analytics.
- Improved collaboration: Looker can help businesses collaborate more effectively by sharing data models and visualizations with others.
- Increased visibility: Looker can help businesses gain visibility into their data by providing them with visualizations that are easy to understand.
5. Klipfolio
Klipfolio is an instant metrics and dashboard tool that helps businesses monitor KPIs and track progress towards goals. It is a powerful tool that can be used by business analysts to create dashboards that are easy to understand and act on.
Klipfolio is easy to use and can be integrated with other BI tools, such as Power BI and Tableau. However, it can be more expensive than some other BI tools.
Here are some of the key features of Klipfolio:
- Drag-and-drop interface: Klipfolio has a drag-and-drop interface that makes it easy to create dashboards and reports without any coding knowledge.
- Wide range of data sources: Klipfolio can connect to a wide range of data sources, including cloud data warehouses, on-premises data warehouses, and flat files.
- Customizable dashboards and reports: Users can customize their dashboards and reports to fit their specific needs.
- Interactive visualizations: Klipfolio provides a variety of interactive visualizations that can be used to represent data in a variety of ways.
- Sharing capabilities: Users can share their dashboards and reports with others.
- Integration with other applications: Klipfolio can be integrated with other applications, such as Salesforce and Google Analytics.
Klipfolio is a powerful tool that can be used by businesses of all sizes. It is a good choice for businesses that are looking to improve their decision-making process by using data.
Here are some of the benefits of using Klipfolio:
- Improved decision-making: Klipfolio can help businesses make better decisions by providing them with insights into their data.
- Increased efficiency: Klipfolio can help businesses save time and effort by automating tasks and providing self-service analytics.
- Improved collaboration: Klipfolio can help businesses collaborate more effectively by sharing dashboards and reports with others.
- Increased visibility: Klipfolio can help businesses gain visibility into their data by providing them with dashboards and reports that are easy to understand.
These are the top 5 business analyst tools for 2023. The best tool for a particular business will depend on its specific needs and requirements. However, all of these tools offer powerful features that can help business analysts improve the decision-making process.


