Top 10 Data Science Tools and Technologies for 2023
Top 10 Data Science Tools and Technologies for 2023
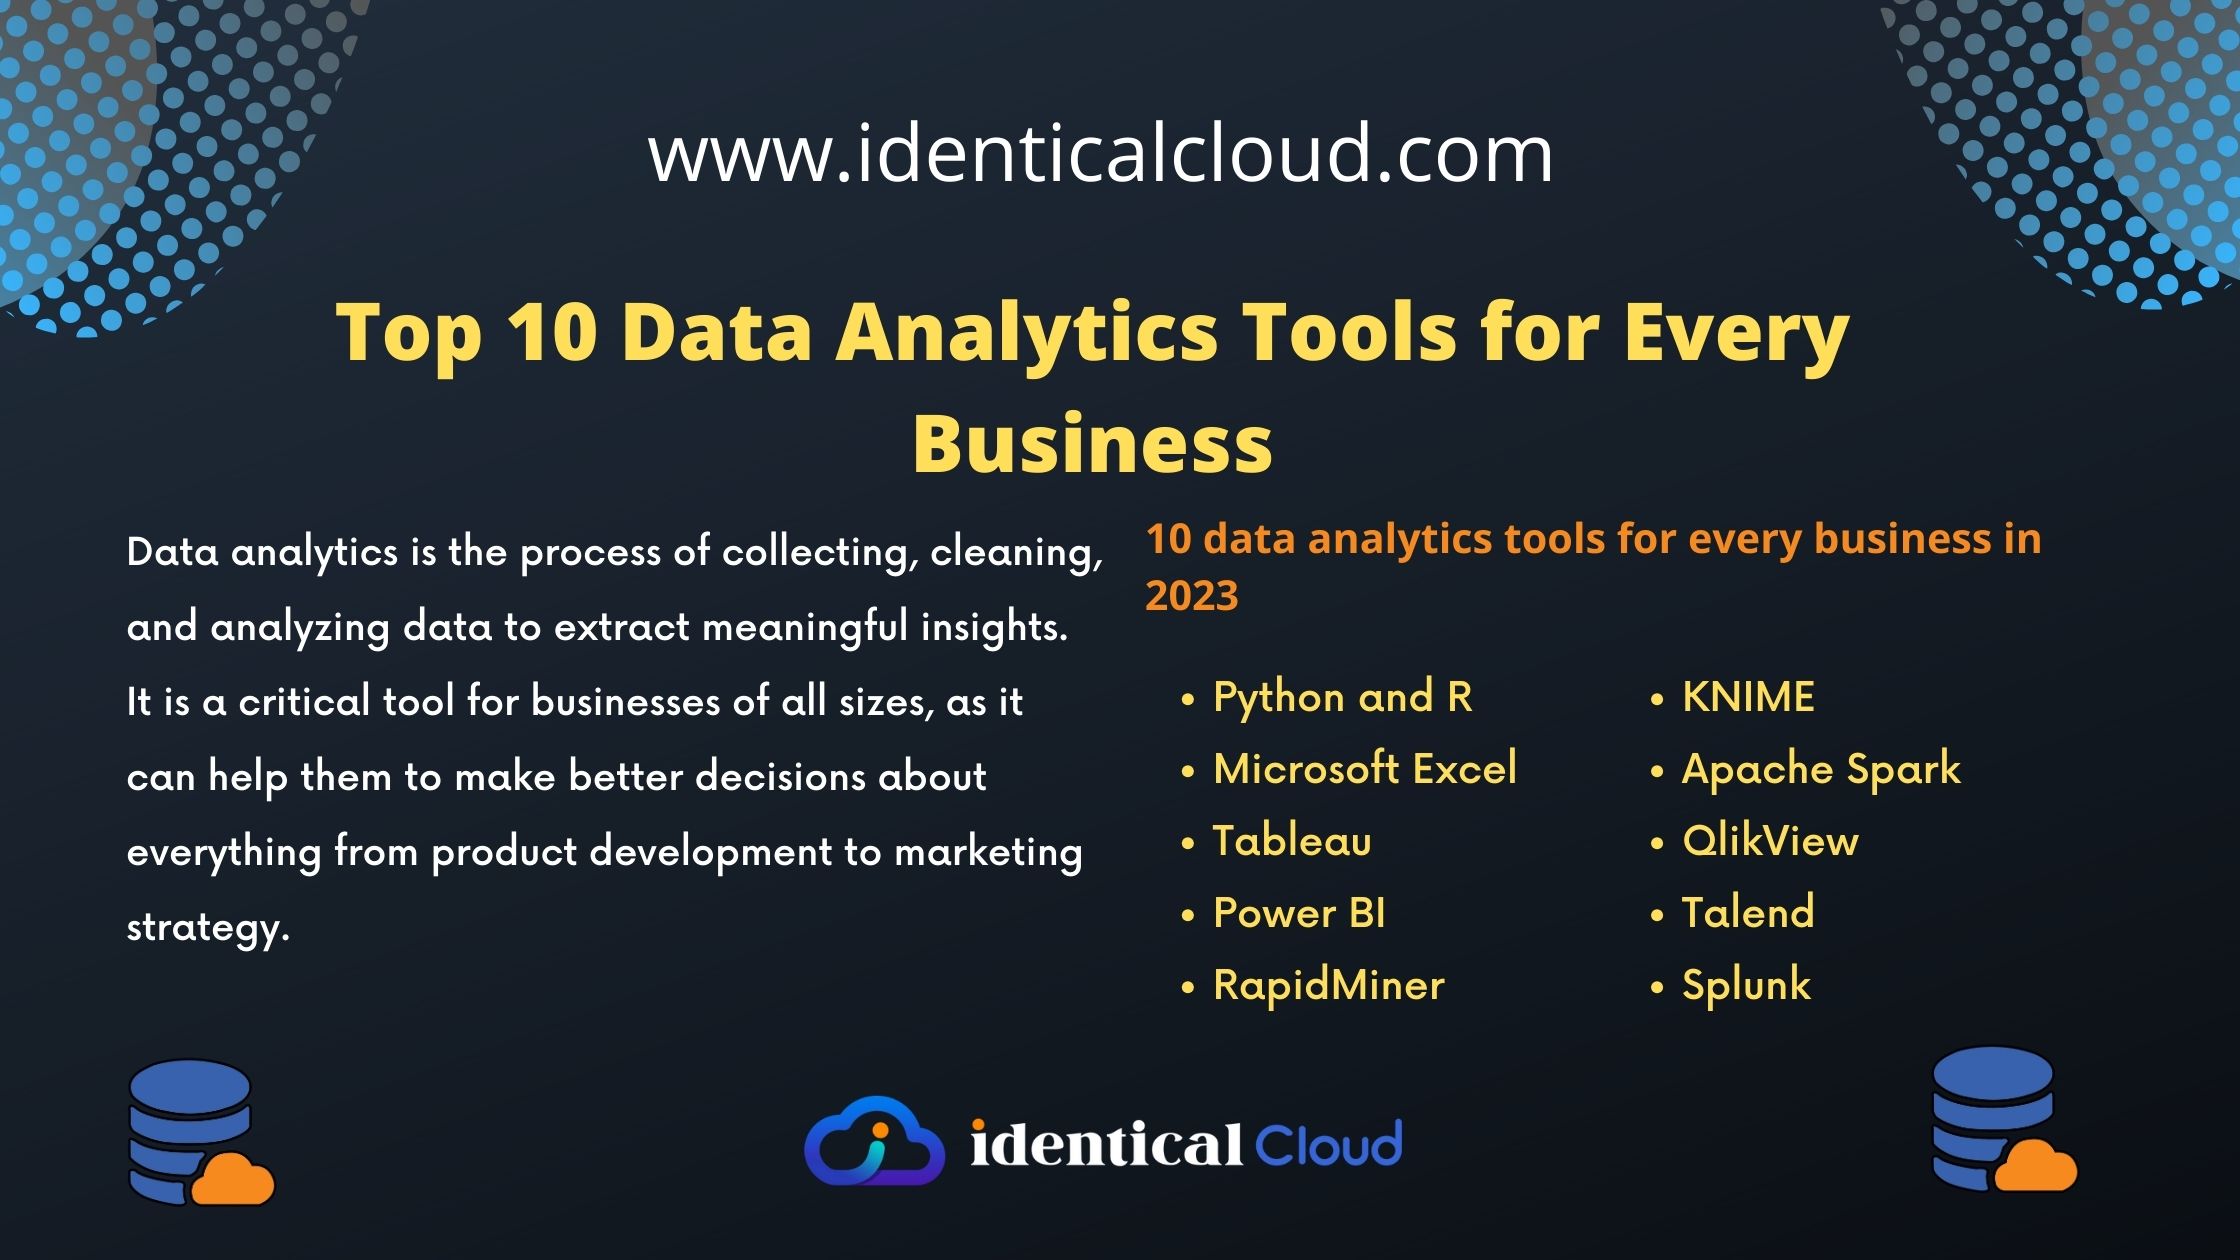
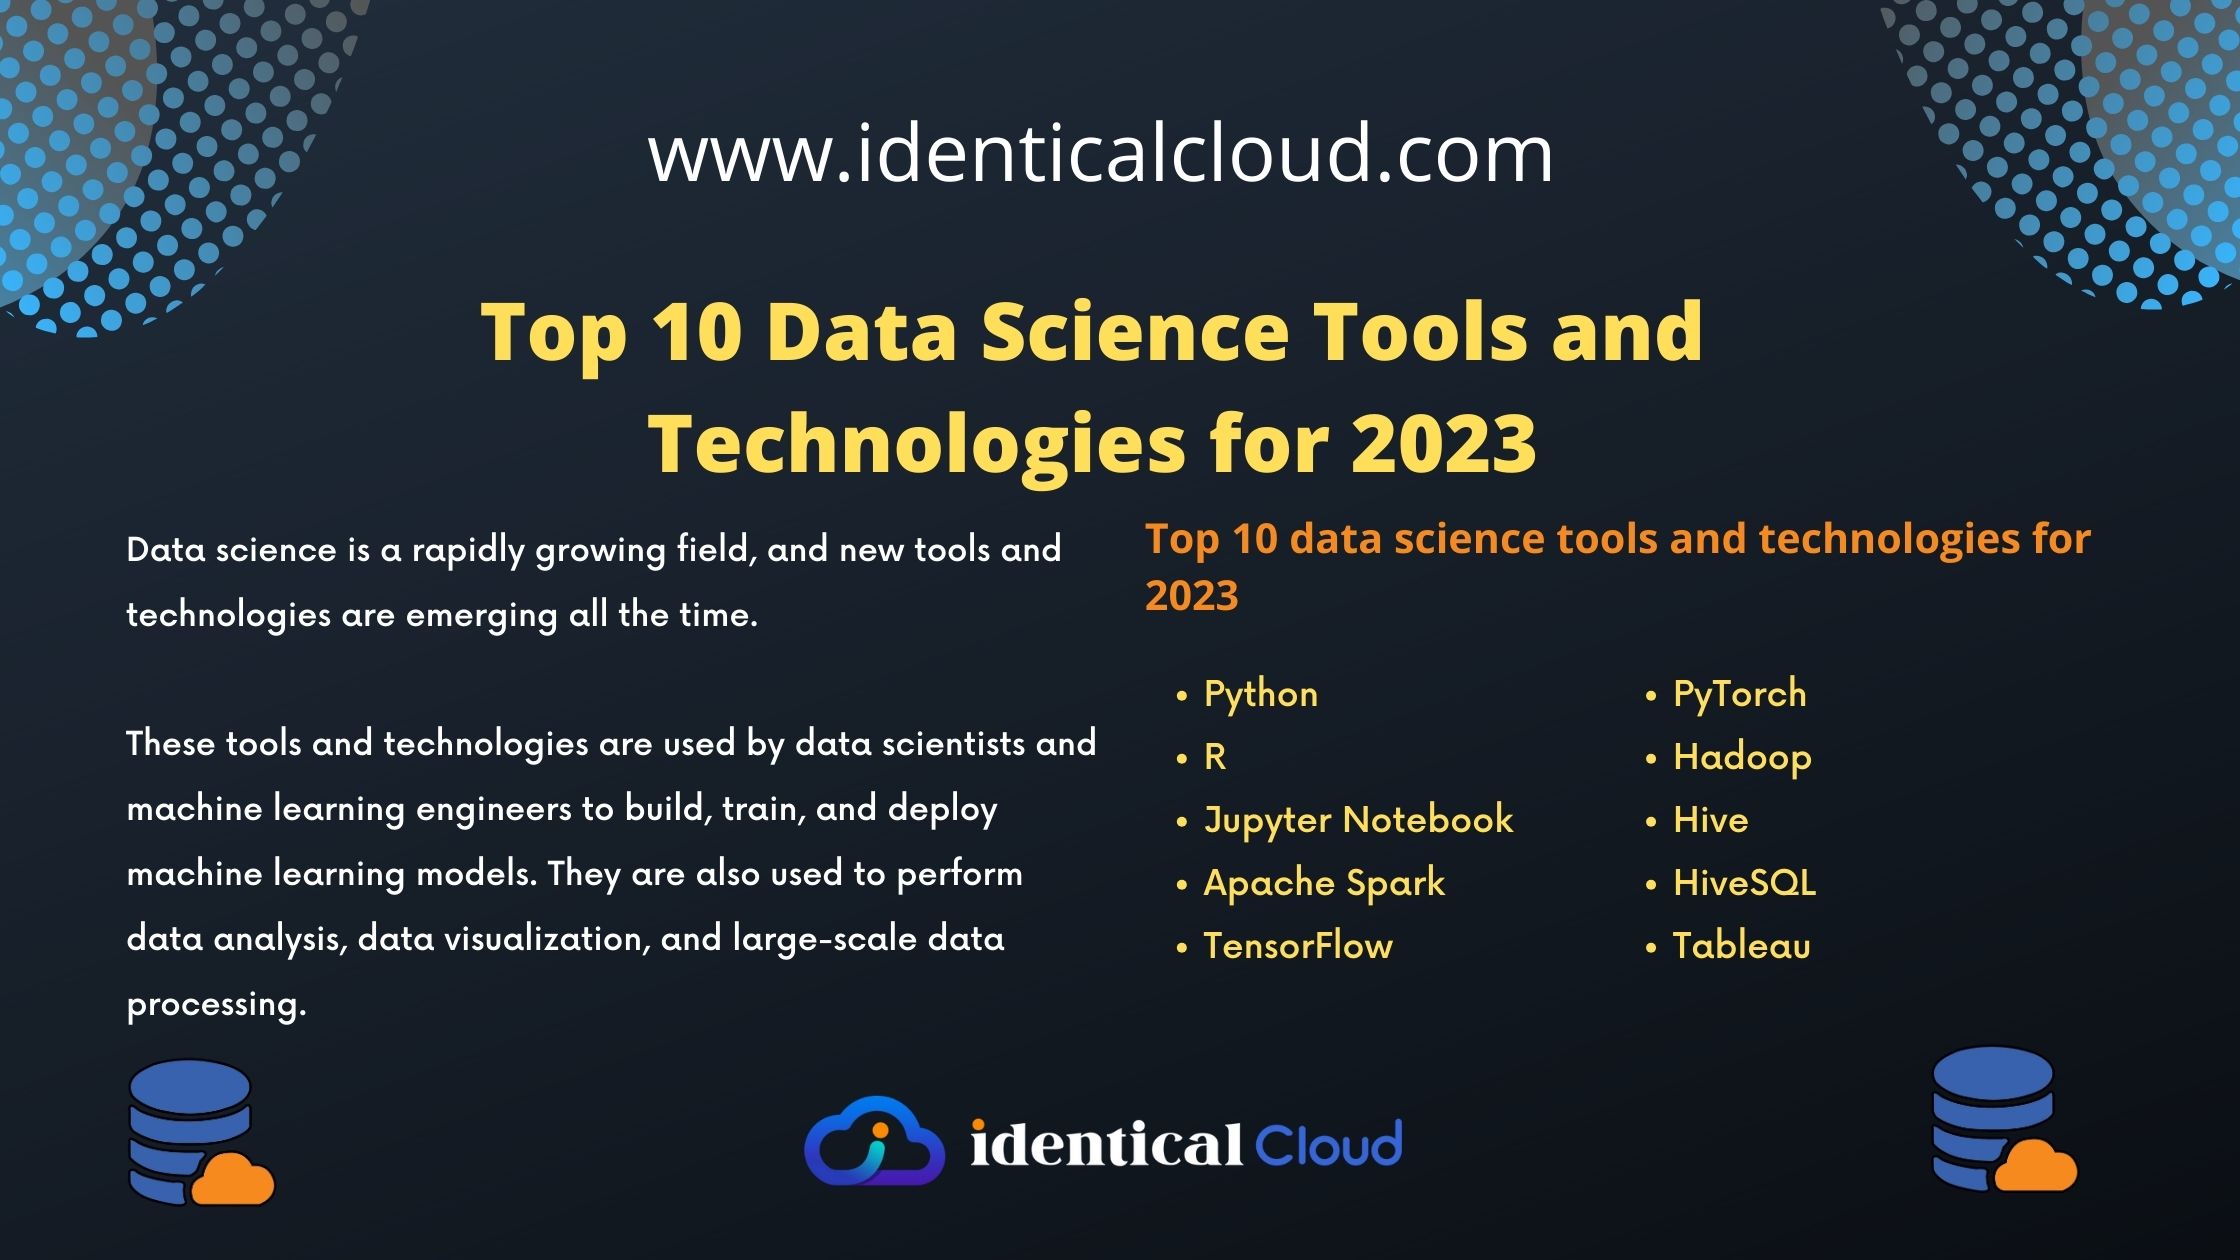
Data science is a rapidly growing field, and new tools and technologies are emerging all the time. It can be difficult to keep up with the latest and greatest, so here is a list of the top 10 data science tools and technologies for 2023:
These tools and technologies are used by data scientists and machine learning engineers to build, train, and deploy machine learning models. They are also used to perform data analysis, data visualization, and large-scale data processing.
Python
Python is a general-purpose programming language that is widely used in data science. It is known for its simplicity, readability, and versatility. Python has a large and active community, which means that there are many libraries and packages available for data science tasks.
Here are some of the benefits of using Python for data science:
- Simple and easy to learn: Python is a relatively simple language to learn, even for beginners. It has a clear and concise syntax that makes it easy to read and write code.
- Versatile: Python can be used for a wide range of data science tasks, including data cleaning, analysis, visualization, and machine learning.
- Large and active community: Python has a large and active community of users and developers. This means that there are many resources available online and in libraries to help you learn Python and use it for data science.
- Free and open source: Python is a free and open source language. This means that you can use it for any purpose, without having to pay a license fee.
Some of the popular Python libraries and packages for data science:
- NumPy: NumPy is a library for scientific computing with Python. It provides a high-performance multidimensional array object and a collection of mathematical functions to operate on arrays.
- Pandas: Pandas is a library for data manipulation and analysis with Python. It provides data structures and operations for working with large, complex datasets.
- Matplotlib: Matplotlib is a library for data visualization with Python. It provides a wide range of plotting functions for creating charts and graphs.
- Scikit-learn: Scikit-learn is a library for machine learning with Python. It provides a variety of machine learning algorithms for classification, regression, clustering, and dimensionality reduction.
Python is a powerful tool for data science, and it is a good choice for data scientists of all skill levels. If you are interested in learning Python for data science, there are many resources available online and in libraries to help you get started.
R
R is a programming language and free software environment for statistical computing and graphics supported by the R Foundation for Statistical Computing. R is similar to Python in terms of its popularity and versatility, but it is particularly well-suited for statistical analysis and visualization.
Here are some of the benefits of using R for data science:
- Powerful statistical capabilities: R is known for its powerful statistical capabilities. It provides a wide range of statistical functions for data analysis, including hypothesis testing, regression analysis, and time series analysis.
- Extensive graphical capabilities: R also provides extensive graphical capabilities. It can be used to create a wide range of plots and graphs, including histograms, scatter plots, and line charts.
- Large and active community: R has a large and active community of users and developers. This means that there are many resources available online and in libraries to help you learn R and use it for data science.
- Free and open source: R is a free and open source language. This means that you can use it for any purpose, without having to pay a license fee.
Some of the popular R packages for data science:
- dplyr: dplyr is a package for data manipulation in R. It provides a set of verbs that can be used to filter, transform, and summarize data.
- ggplot2: ggplot2 is a package for data visualization in R. It provides a grammar of graphics that can be used to create complex and informative plots.
- caret: caret is a package for machine learning in R. It provides a variety of machine learning algorithms for classification, regression, and clustering.
R is a powerful tool for data science, and it is a good choice for data scientists of all skill levels. If you are interested in learning R for data science, there are many resources available online and in libraries to help you get started.
Jupyter Notebook
Jupyter Notebook is an open-source web application that allows you to create and share documents that contain live code, equations, visualizations, and narrative prose. Jupyter Notebook is a popular tool for data science because it makes it easy to experiment with code and ideas and to document your work.
Here are some of the benefits of using Jupyter Notebook for data science:
- Interactive: Jupyter Notebook is an interactive environment, which means that you can execute code and see the results immediately. This makes it easy to experiment with code and to debug errors.
- Documentary: Jupyter Notebook is a documentary tool, which means that you can include text, code, and visualizations in the same document. This makes it easy to document your work and to share it with others.
- Versatile: Jupyter Notebook can be used for a wide range of data science tasks, including data cleaning, analysis, visualization, and machine learning.
- Free and open source: Jupyter Notebook is a free and open source tool. This means that you can use it for any purpose, without having to pay a license fee.
Jupyter Notebook is a powerful tool for data science, and it is a good choice for data scientists of all skill levels. If you are interested in learning Jupyter Notebook for data science, there are many resources available online and in libraries to help you get started.
Here are some tips for using Jupyter Notebook for data science:
- Use a variety of cells: Jupyter Notebook allows you to create different types of cells, including code cells, markdown cells, and raw cells. Use different types of cells to organize your work and to make it easier to read.
- Add comments: Add comments to your code to explain what it does and why. This will make your code easier to read and maintain.
- Use version control: Use a version control system, such as Git, to track changes to your code and to collaborate with others.
- Share your work: Share your work with others by exporting your notebooks to HTML, PDF, or other formats.
Jupyter Notebook is a powerful tool for data science, and it can help you to be more productive and efficient in your work.
Apache Spark
Apache Spark is a unified analytics engine that can be used for large-scale data processing and machine learning. Spark is known for its speed and scalability, and it can be used to process data on a variety of platforms, including Hadoop, Amazon S3, and Google Cloud Storage.
Here are some of the benefits of using Apache Spark for data science:
- Speed and scalability: Spark is a very fast and scalable engine. It can process large datasets in a short period of time, and it can scale to handle even the largest datasets.
- Easy to use: Spark is relatively easy to use, even for beginners. It provides a high-level API that makes it easy to develop and run data science workloads.
- Versatility: Spark can be used for a wide range of data science tasks, including data cleaning, analysis, visualization, and machine learning.
- Fault-tolerant: Spark is a fault-tolerant engine, which means that it can continue to operate even if some of its nodes fail.
Some of the popular Spark libraries for data science:
- Spark SQL: Spark SQL is a library for SQL queries on Spark. It provides a high-performance SQL engine that can be used to query data from a variety of sources, including Hadoop, Amazon S3, and Google Cloud Storage.
- Spark MLlib: Spark MLlib is a library for machine learning on Spark. It provides a variety of machine learning algorithms for classification, regression, clustering, and dimensionality reduction.
- Spark GraphX: Spark GraphX is a library for graph processing on Spark. It provides a variety of graph algorithms for tasks such as shortest path, community detection, and page rank.
Apache Spark is a powerful tool for data science, and it is a good choice for data scientists of all skill levels. If you are interested in learning Apache Spark for data science, there are many resources available online and in libraries to help you get started.
TensorFlow
TensorFlow is an open-source machine learning framework that can be used to build and train machine learning models. TensorFlow is known for its flexibility and performance, and it is used by a wide range of companies, including Google, Microsoft, and Amazon. TensorFlow is known for its flexibility and performance, and it can be used to build and train machine learning models for a wide range of tasks:
- Image classification
- Natural language processing
- Speech recognition
- Machine translation
- Recommender systems
- Game playing
TensorFlow is a powerful tool for machine learning, but it can be complex to learn. However, there are many resources available online and in libraries to help you learn TensorFlow.
PyTorch
PyTorch is an open-source machine learning library that is built on top of Torch. PyTorch is known for its simplicity and ease of use, and it is a popular choice for research and development in machine learning.
Here are some of the benefits of using PyTorch for machine learning:
- Flexibility: PyTorch is a very flexible machine learning library. It can be used to build and train a wide range of machine learning models, including deep learning models, natural language processing models, and computer vision models.
- Ease of use: PyTorch is a relatively easy machine learning library to learn. It has a simple and intuitive API, and it is well-documented.
- Speed: PyTorch is a fast machine learning library. It can train and run machine learning models on a variety of platforms, including CPUs, GPUs, and TPUs.
- Community support: PyTorch has a large and active community of users and developers. This means that there are many resources available online and in libraries to help you learn and use PyTorch.
Some of the popular PyTorch libraries for machine learning:
- PyTorch Lightning: PyTorch Lightning is a high-level API for PyTorch. It provides a simple and easy-to-use way to build and train machine learning models.
- PyTorch Ignite: PyTorch Ignite is a library for training and evaluating machine learning models. It provides a variety of tools for data preprocessing, model training, and model evaluation.
- PyTorch Geometric: PyTorch Geometric is a library for graph mining and machine learning. It provides a variety of tools for graph preprocessing, graph analysis, and graph machine learning.
PyTorch is a powerful tool for machine learning, and it is a good choice for machine learning engineers of all skill levels. If you are interested in learning PyTorch for machine learning, there are many resources available online and in libraries to help you get started.
Hadoop
Apache Hadoop is an open-source software framework for distributed storage and processing of large data sets on clusters of commodity hardware. Hadoop is a popular choice for storing and processing big data, and it is used by many companies, including Yahoo, Facebook, and Twitter.
Hadoop is based on the idea that the best way to deal with large data sets is to break them down into smaller pieces and process them in parallel. This allows Hadoop to handle very large data sets that would be difficult or impossible to process on a single machine.
Hadoop is made up of two main components:
- Hadoop Distributed File System (HDFS): HDFS is a distributed file system that stores data across multiple machines. It is designed to be reliable and scalable, and it can handle very large data sets.
- MapReduce: MapReduce is a programming model for processing large data sets in parallel. It breaks down a large data set into smaller pieces, which are then processed in parallel by multiple machines.
Hadoop is a powerful tool for processing large data sets, and it is used by a wide range of companies, including Google, Facebook, and Yahoo. It is well-suited for a variety of data processing tasks, including:
- Log processing
- Web indexing
- Scientific computing
- Machine learning
Here are some of the benefits of using Hadoop for data science:
- Scalability: Hadoop is very scalable, and it can be used to process very large data sets.
- Reliability: Hadoop is a reliable platform for processing large data sets. It can handle failures of individual machines without losing data.
- Flexibility: Hadoop is a flexible platform that can be used for a variety of data processing tasks.
- Cost-effectiveness: Hadoop is a cost-effective platform for processing large data sets. It can be deployed on commodity hardware, which is relatively inexpensive.
Some of the popular Hadoop libraries for data science include:
- Apache Hive: Hive is a data warehouse software project built on top of Apache Hadoop for providing data query and analysis. Hive gives an SQL-like interface to query data stored in various databases and file systems that integrate with Hadoop.
- Apache Pig: Pig is a platform for creating programs to run on Hadoop. Programs written in Pig are called Pig Latin scripts, and they are usually shorter and easier to write than MapReduce programs.
- Apache Mahout: Mahout is a scalable machine learning library for Hadoop. It provides a variety of machine learning algorithms, including classification, regression, and clustering.
Hadoop is a powerful tool for data science, and it is a good choice for data scientists of all skill levels. If you are interested in learning Hadoop for data science, there are many resources available online and in libraries to help you get started.
Hive
Apache Hive is a data warehouse software project built on top of Apache Hadoop for providing data query and analysis. Hive gives an SQL-like interface to query data stored in various databases and file systems that integrate with Hadoop.
Hive is a popular tool for data science because it makes it easy to query and analyze large data sets. It is also relatively easy to learn, especially for users who are already familiar with SQL.
Here are some of the benefits of using Hive for data science:
- Easy to use: Hive is a relatively easy tool to learn, especially for users who are already familiar with SQL.
- Scalable: Hive can be used to query and analyze very large data sets.
- Flexible: Hive can be used to query data stored in a variety of databases and file systems.
- Community support: Hive has a large and active community of users and developers. This means that there are many resources available online and in libraries to help you learn and use Hive.
Some of the popular Hive libraries for data science include:
- HiveQL: HiveQL is a dialect of SQL that is used to query data stored in Hive. HiveQL is similar to standard SQL, but it has some additional features that are specific to Hive.
- Hive-JDBC: Hive-JDBC is a JDBC driver for Hive. It allows you to connect to Hive from a variety of programming languages, including Java, Python, and R.
- Hive-ODBC: Hive-ODBC is an ODBC driver for Hive. It allows you to connect to Hive from a variety of business intelligence (BI) tools.
Hive is a powerful tool for data science, and it is a good choice for data scientists of all skill levels. If you are interested in learning Hive for data science, there are many resources available online and in libraries to help you get started.
Here are some tips for using Hive for data science:
- Use the right Hive library: There are a variety of Hive libraries available for data science tasks. Choose the right library for the task you are trying to accomplish.
- Use HiveQL to query data: HiveQL is a dialect of SQL that is used to query data stored in Hive. HiveQL is similar to standard SQL, but it has some additional features that are specific to Hive.
- Use Hive-JDBC to connect to Hive from other programming languages: Hive-JDBC is a JDBC driver for Hive. It allows you to connect to Hive from a variety of programming languages, including Java, Python, and R. This can be useful for writing HiveQL scripts or for developing data science applications.
- Use Hive-ODBC to connect to Hive from BI tools: Hive-ODBC is an ODBC driver for Hive. It allows you to connect to Hive from a variety of business intelligence (BI) tools. This can be useful for creating reports and dashboards from your data.
Hive is a powerful tool for data science, and it can help you to be more productive and efficient in your work.
HiveSQL
HiveSQL is a dialect of SQL that is used to query data stored in Hive. HiveSQL is a popular choice for data analysis because it is easy to learn and use, and it can be used to query data from a variety of sources.
HiveSQL is a popular tool for data science because it makes it easy to query and analyze large data sets. It is also relatively easy to learn, especially for users who are already familiar with SQL.
Here are some of the benefits of using HiveSQL for data science:
- Easy to use: HiveSQL is a relatively easy tool to learn, especially for users who are already familiar with SQL.
- Scalable: HiveSQL can be used to query and analyze very large data sets.
- Flexible: HiveSQL can be used to query data stored in a variety of databases and file systems.
- Community support: HiveSQL has a large and active community of users and developers. This means that there are many resources available online and in libraries to help you learn and use HiveSQL.
Here are some tips for using HiveSQL for data science:
- Use the right HiveSQL library: There are a variety of HiveSQL libraries available for data science tasks. Choose the right library for the task you are trying to accomplish.
- Use HiveQL to query data: HiveQL is a dialect of SQL that is used to query data stored in Hive. HiveQL is similar to standard SQL, but it has some additional features that are specific to Hive.
- Use Hive-JDBC to connect to Hive from other programming languages: Hive-JDBC is a JDBC driver for Hive. It allows you to connect to Hive from a variety of programming languages, including Java, Python, and R. This can be useful for writing HiveQL scripts or for developing data science applications.
- Use Hive-ODBC to connect to Hive from BI tools: Hive-ODBC is an ODBC driver for Hive. It allows you to connect to Hive from a variety of business intelligence (BI) tools. This can be useful for creating reports and dashboards from your data.
HiveSQL is a powerful tool for data science, and it can help you to be more productive and efficient in your work.
Here are some examples of HiveSQL queries that can be used for data science tasks:
1. Select the top 10 most popular products:
SELECT product_id, product_name, COUNT(*) AS num_orders
FROM orders
GROUP BY product_id, product_name
ORDER BY num_orders DESC
LIMIT 10;
2. Calculate the average order value for each customer:
SELECT customer_id, AVG(order_total) AS avg_order_value
FROM orders
GROUP BY customer_id
ORDER BY avg_order_value DESC;
3. Identify customers who have not placed an order in the last 6 months:
SELECT customer_id, customer_name
FROM customers
WHERE last_order_date < DATE_SUB(CURRENT_DATE, INTERVAL 6 MONTH);
These are just a few examples, and HiveSQL can be used to perform a wide variety of data science tasks. If you are interested in learning more about HiveSQL, there are many resources available online and in libraries.
Tableau
Tableau is a data visualization software package that allows you to create interactive dashboards and reports. Tableau is a popular choice for data visualization because it is easy to use and can produce high-quality visualizations.
Tableau is a data visualization software that is widely used by data scientists to create interactive and informative visualizations. It is known for its ease of use, powerful features, and extensive library of visualizations.
Here are some of the benefits of using Tableau for data science:
- Easy to use: Tableau has a user-friendly interface that makes it easy to create visualizations, even for beginners.
- Powerful features: Tableau offers a wide range of features for data visualization, including data aggregation, filtering, sorting, and calculations.
- Extensive library of visualizations: Tableau has a library of over 30 different visualization types, including charts, maps, and dashboards.
- Interactive visualizations: Tableau visualizations are interactive, which means that users can explore the data by hovering, clicking, and dragging.
Tableau is a powerful tool for data science, and it can be used to create a variety of visualizations:
- Exploratory data analysis (EDA) visualizations: EDA visualizations can be used to explore and understand data sets. Common EDA visualizations include histograms, scatter plots, and box plots.
- Communication and storytelling visualizations: Communication and storytelling visualizations can be used to communicate insights from data to others. Common communication and storytelling visualizations include dashboards, charts, and maps.
- Machine learning visualizations: Machine learning visualizations can be used to interpret and understand the results of machine learning models. Common machine learning visualizations include confusion matrices, ROC curves, and feature importance charts.
Tableau is a popular tool for data scientists of all skill levels, and it can help you to be more productive and efficient in your work.
Here are some tips for using Tableau for data science:
- Start with a clear objective: What do you want to learn from your data? Once you know your objective, you can choose the right visualizations to help you achieve it.
- Prepare your data: Before you start creating visualizations, it is important to prepare your data. This may involve cleaning, transforming, and aggregating your data.
- Use the right visualizations: Tableau has a library of over 30 different visualization types. Choose the right visualizations for your data and your objective.
- Annotate your visualizations: Add annotations to your visualizations to explain what they are showing and to highlight key insights.
- Share your visualizations: Once you have created your visualizations, share them with others to communicate your findings.
Tableau is a powerful tool for data science, and it can help you to be more effective in your work. If you are interested in learning Tableau, there are many resources available online and in libraries.
Data science is a powerful tool that can be used to solve a variety of problems. By choosing the right tools and technologies, and by learning how to use them, you can start to reap the benefits of data science.
These are just a few of the many data science tools and technologies that are available. When choosing tools and technologies, it is important to consider your specific needs and requirements. You should also consider the size and complexity of your data, as well as your budget.

