Monitor website and API’s health check and uptime status using AWS Synthetic
Every website owner always has one simple thought in their mind. How do I know if my website is up? What if it goes down? To resolve the issue is the second step, first step is to know that website is down before the client reports it.
Maintaining website uptime 24*7 is an important factor for any business. Although at starting stage if your team size is small, and you don’t have a specific operation or DevOps team to take care of these issues, you can be in trouble. At this point, you can set up automated monitoring for your website and get notified if it is down.
In AWS, If your server’s hardware fails, AWS Cloudwatch provides metric for that, you can also monitor CPU utilization, network I/O utilization but what about your API endpoint? here, we are talking about your web server which can be NGINX or Apache running on ports 80 and 443, REST APIs running on any custom port e.g. 5000,8000,4000. How do you monitor this on the EC2 instance?
In this tutorial, we will see step by step guide on how you can set up monitoring for your website uptime using AWS services
We will use AWS Cloudwatch Synthetics for this, which in the end will use AWS Lambda function and SNS for notification
Prerequisites
- You have an endpoint for your website’s health check
- which can be simple URL or /health-check API
- You have access to run this health check on your website every few minutes
Let’s Get started
- Log in to AWS Console
- Go to Services -> AWS Cloudwatch
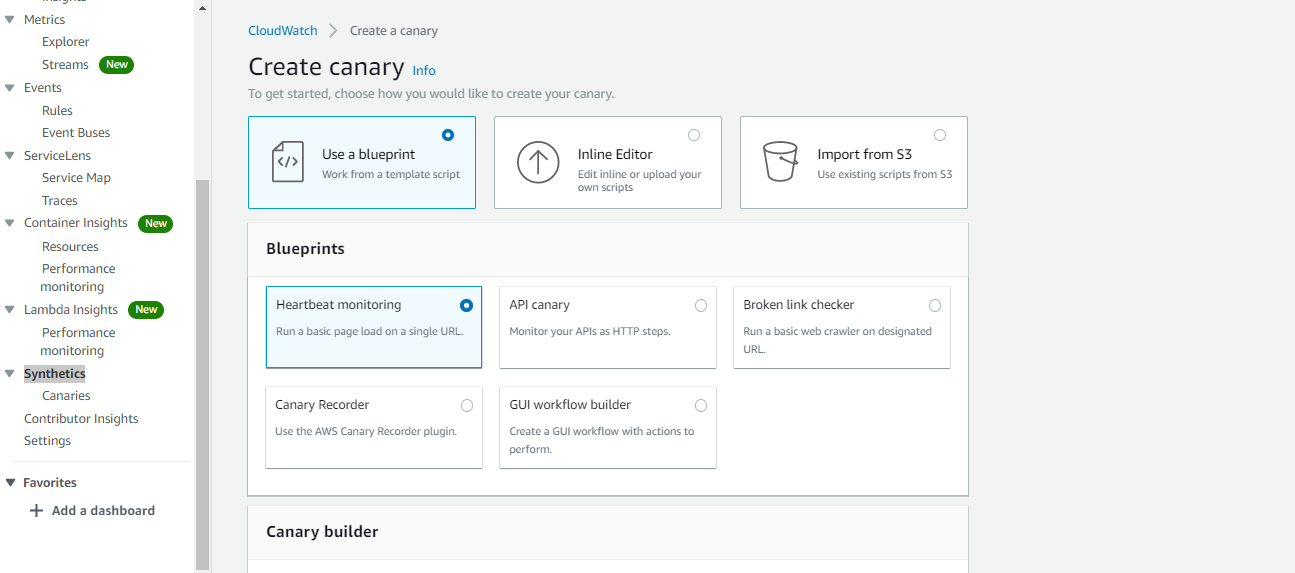
- From the left panel, Select Synthetics
- Click on Create Canary
- Select Use a blueprint
- At Blueprints, select Heartbeat monitoring
- Name your canary
- Put your Application or endpoint URL
- which can be the domain name or IP with HTTP or HTTPS protocol and port number mentioned
e.g.
1. https://example.com
2. http://1.2.3.4:80/
3. http://1.2.3.4.:5000/
- which can be the domain name or IP with HTTP or HTTPS protocol and port number mentioned
- Untick Take screenshots
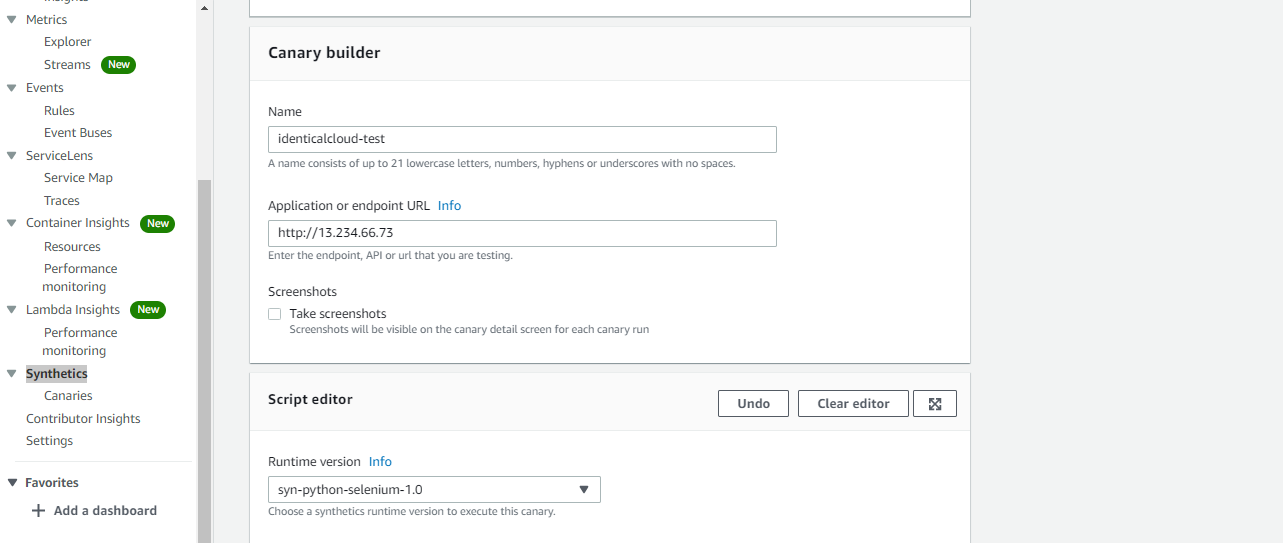
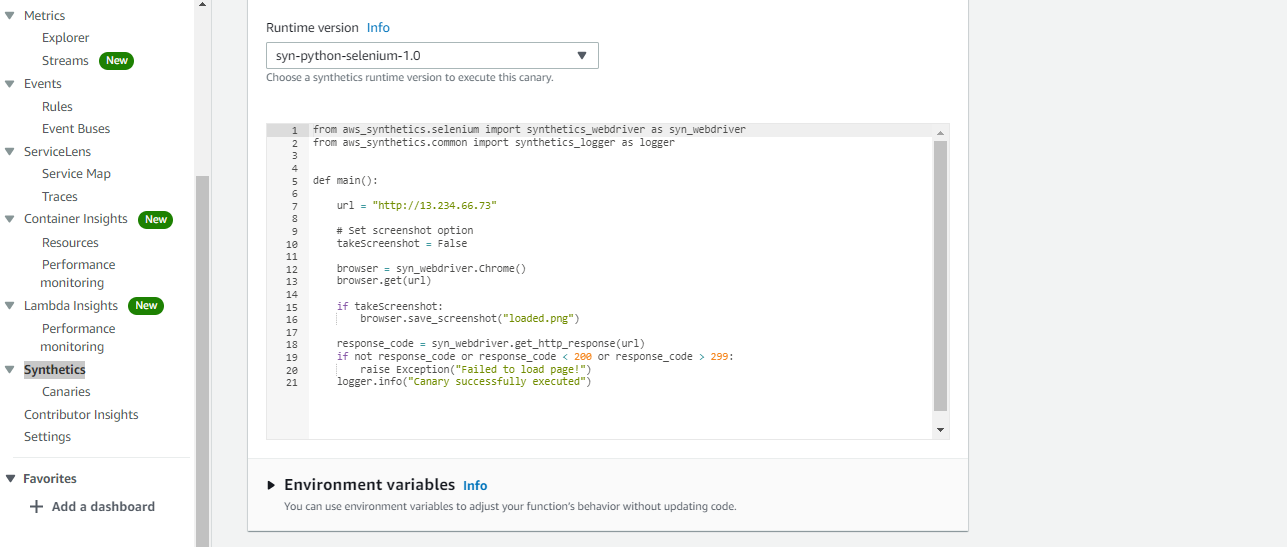
- Select runtime, as NodeJS or python (as per your choice)
- This step will create a lambda function which will call your endpoint and see if it receives 200 status code or not.
- Next, you can set Environment variables if needed, for this article, you can skip this step (optional)
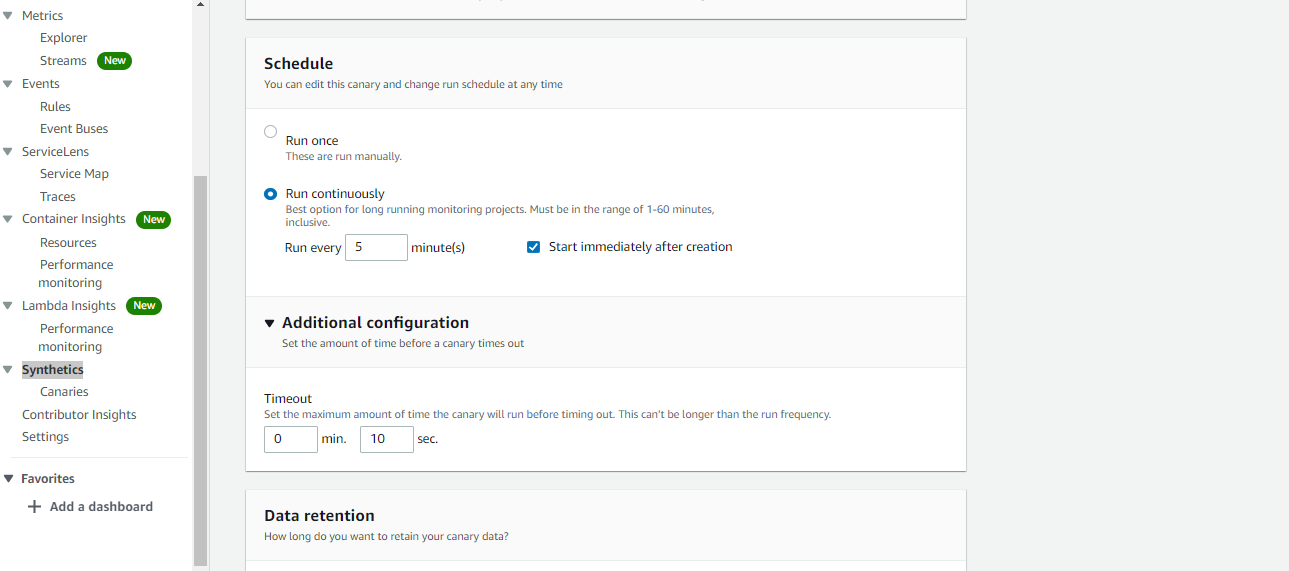
- Now, you need to schedule, when do you want to perform a health check.
- It can be just once, for test purpose
- or every 1 min/5 min/15 min as per your use case
- Define a timeout for your endpoint, This can’t be longer than the run frequency.
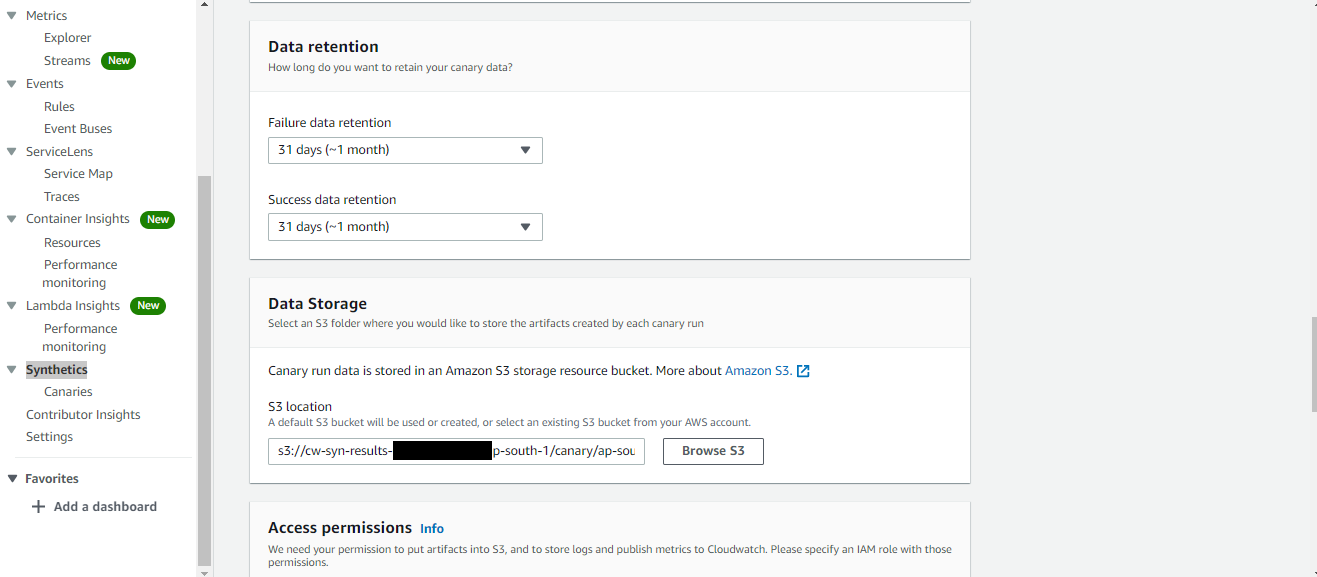
- Next is Data retention, for how long you want to store results of your health check
- which has 2 options, 1 for failure data and 1 for success data
- it will save data in an S3 bucket
- Next is to select, S3 bucket to store data
- you can create a new one or select an existing one
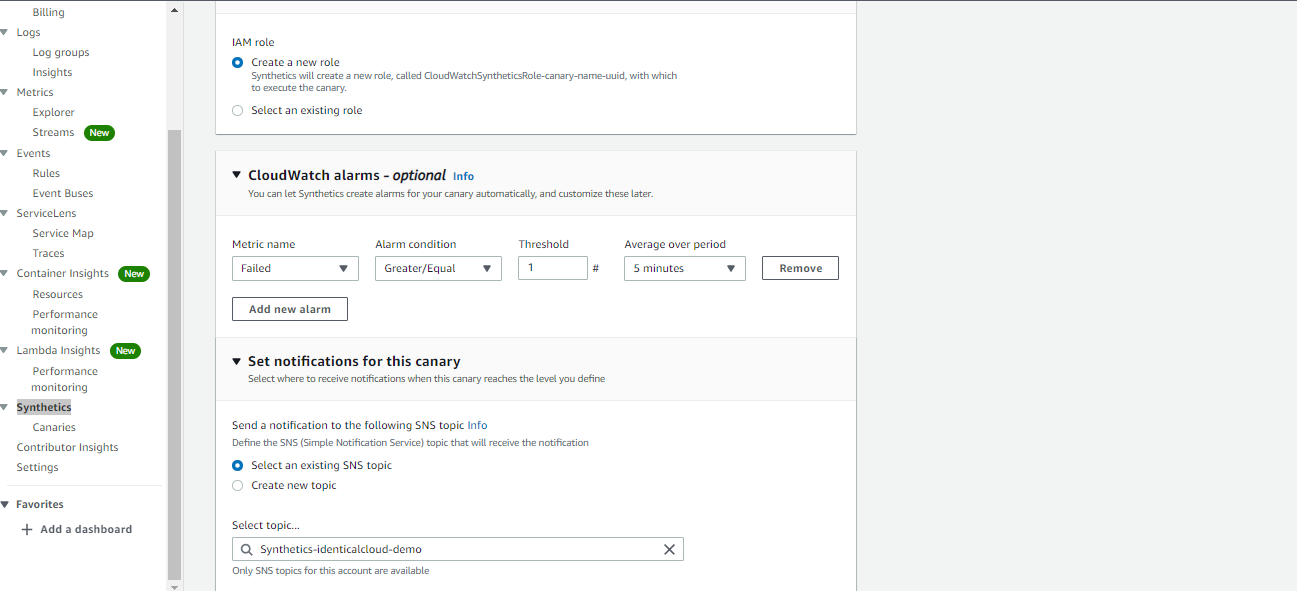
- Next, Select Access permissions means IAM role
- Create a new one, so it will take all required permissions, like lambda function and s3 access, SNS access, etc.
- Now, let’s create a Cloudwatch alarm to get notified when health check fails
- Click on Add new alarm
- Select MetricName as Failed, Greater/Equal 1, and select average as per your schedule
- Create a new SNS topic and enter email IDs which should be notified when the canary fails or select an existing SNS topic
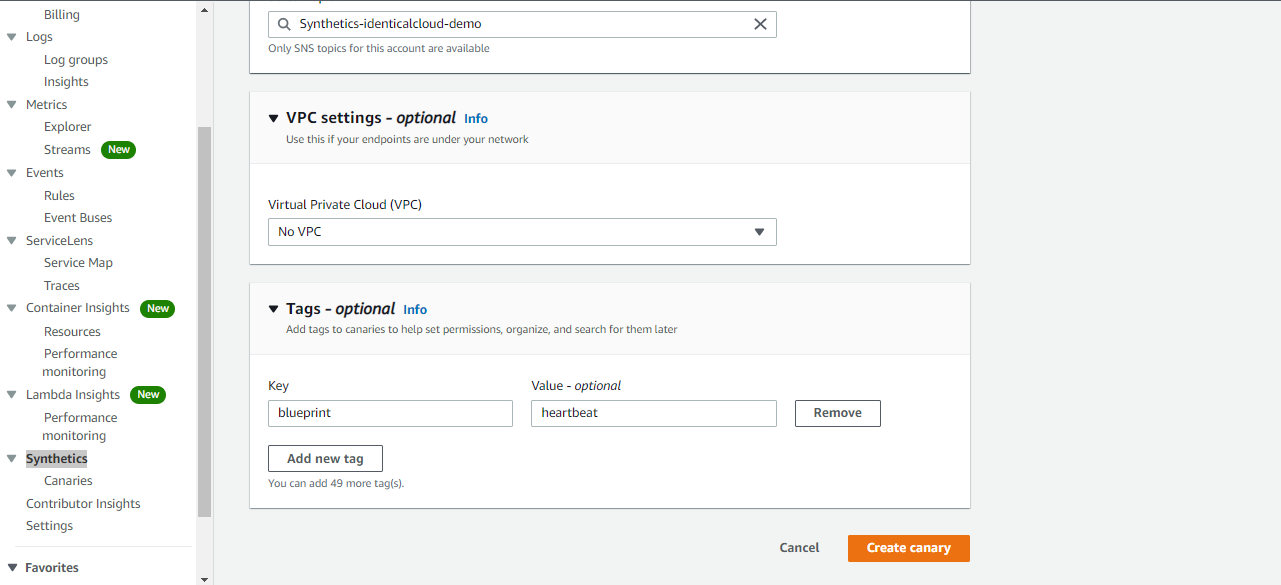
- Select VPC, if your endpoint is private, for public it is not necessary
- For private VPC, select the same VPC and subnet where your endpoint is present
- Also, make sure, VPC endpoint for synthetics and S3 bucket is created
- Provide Tags are per your requirement
- And Create
This canary will run now at your given time, and will keep you updated with API’s health check status. After you get notified with down alert, you can take actions as soon as possible.
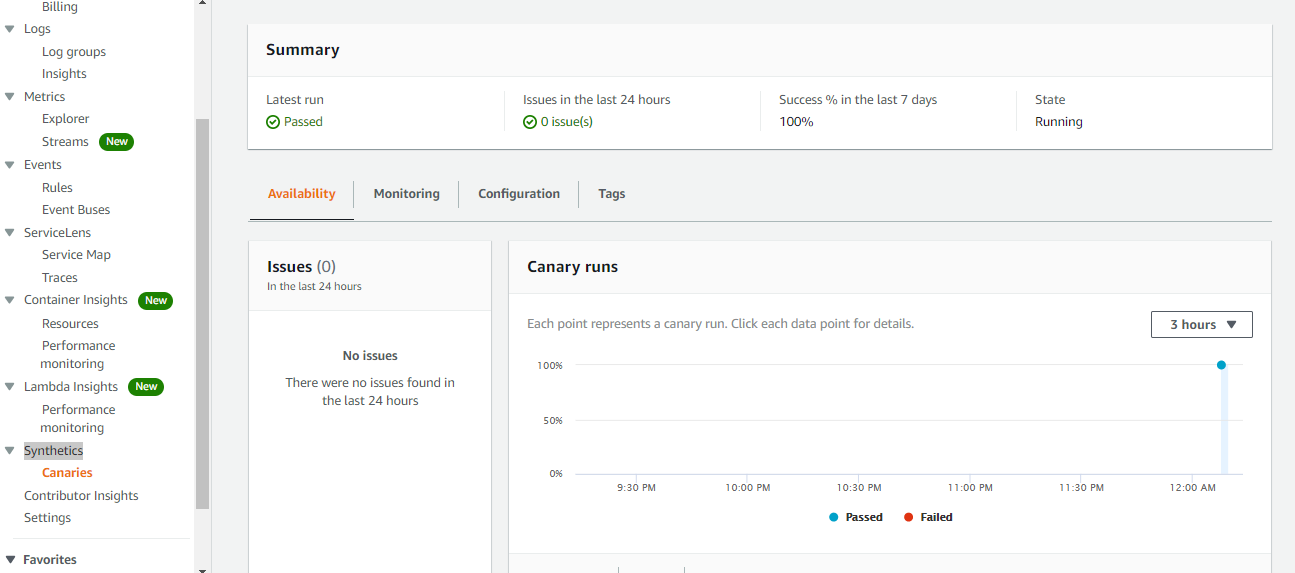
With AWS SNS, you can also set up to be notified on the slack channel or SMS or Email address, etc.
We hope this article is useful to you. Let us know your views in the comment section below.
Drafted On,
22nd January 2022
DevOps @identicalCloud.com
References:


